Here is a number to remember: .994 (and not because 994 is the country telephone code for Azerbaijan).
The measure of poverty most commonly used by the World Bank is the “headcount”: the proportion of people below a poverty line, a fixed level of income or consumption expenditures (CEX) per capita. The Foster, Greer and Thorbecke (1986) measures of poverty are weighted sums of people from a given distribution of consumption expenditures (or income), and the headcount is the simple case where the weights are equal for each person, irrespective of how far from the poverty line their CEX is.
This leads to a simple question: “How much of the observed variation in headcount poverty rates across countries is due to variation in the median of the distribution of consumption expenditures?”
The answer, shown in Figure 1, is (roughly) “All of it.” The R-Squared of the median (with various powers to account for non-linearity) for explaining headcount poverty for the three poverty lines is:
- $5.50 per day, R-Squared=.988, correlation(poverty, predicted)=.994
- $3.20 per day, R-Squared=.988, correlation(poverty, predicted)=.994
- $1.90 per day, R-Squared=.983, correlation(poverty, predicted)=.991
The simple correlation between the actual $3.20/day or $5.50/day headcount poverty rate and headcount poverty as predicted using only the median of the country distribution is .994 and for $1.90 it is .991. These are about as high a correlation as real world data can produce.
Figure 1: Headcount poverty rates are extremely highly associated with median consumption expenditures
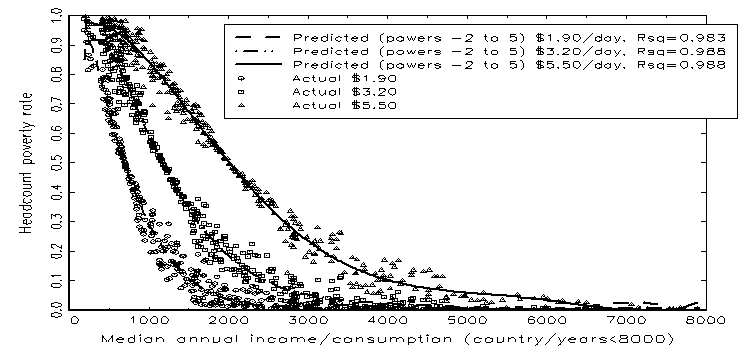
Source: Author’s calculations based on data from: “PovcalNet: the on-line tool for poverty measurement developed by the Development Research Group of the World Bank”
The regression uses the 389 country/time observations from the World Bank data that are based on consumption expenditures (not income) and recent data (not distant extrapolations). Since headcount poverty is a partial integral of a distribution of consumption expenditures the relationship between the median and headcount has to be non-linear. I use powers of the median from -2 to 5 to allow for flexible non-linearity.
Nancy Birdsall and Christian Meyer have argued that for development issues “The Median is the Message.” For headcount poverty they are completely right. The answer to the question: “Why does a country at a given time have headcount poverty rate it does?” is “Because of its median of consumption expenditure.” Pretty much full stop. Conditional on the median, any and all other factors or variables can explain at most 1.2 percent of the variation in country headcount poverty rates (maybe 0, but at most 1.2).
You might be saying, “Lant, why are you making such a big deal of this correlation?” Well, thanks for asking.
This very tight correlation is not built in. One can usefully decompose (as many have done) the difference in poverty rates comparing two distributions (between countries or over time) into three elements on the (mostly accurate) assumption the distribution is log-normal (that is, the natural log of consumption expenditures is distributed as a Gaussian normal distribution):
- Differences in the central tendency of the log-normal distribution,
- Differences in the variance of the log-normal distribution and
- Differences in the distribution below the poverty line being more or less favorable to poverty than would be expected of a log-normal of a given central tendency and variance (as the log-normal is a two-parameter distribution this forces an exact shape).
How much of the variance in headcount poverty is an empirical fact that depends on the actual distributions of consumption expenditures across countries and the fact that (2) and (3) account for 1.2 percent of the variance could have been otherwise, it is not cooked into definitions. In fact, one can easily imagine policies or programs that would bring up the lower tail, and hence reduce poverty, much more than the log-normal would predict. So it is a striking finding that both differences in variance (inequality) with the assumption of log-normality and deviations from log-normality below the poverty line together account for at most 1.2 percent of observed variation in poverty.
Included in the country/time varying factors whose variation in the observed data cannot explain more than 1.2 percent of the observed variation in headcount poverty rates are things like: “budget (government or other) devoted to anti-poverty programs” and “efficacy of the design of anti-poverty programs” or “whether the country’s anti-poverty programs are ‘evidence based’” or, for that matter, any interaction of those factors, like: “whether a country devoted budget to well-designed anti-poverty programs based on evidence.” The median explains nearly all variation in poverty across countries with no reference to targeted programs of any kind: not micro-credit, not conditional cash transfers, not chickens, not livelihood programs, nothing that claims to impact poverty without changing the median.
Given the amount of time, energy, intellectual firepower, academic publication, and advocacy that go into discussions of anti-poverty programs one might think they are a large part of the “solution” to global poverty. But they just have not been. If your median consumption expenditure went up then your headcount poverty went down and nothing else that any country has done besides that seems to be very important in explaining poverty reduction.
The relative importance of growth of median consumption expenditures versus “all else” can be illustrated with two different poverty lines at two different levels of income, the “extreme poverty” penurious poverty line that the World Bank often uses (but which I think is fundamentally illegitimate as it is too low) and the “$5.50/day” line (which I think is still too low).
The predicted level of $1.90/day “extreme poverty” for a country at the average income of the lowest quartile of countries is 72.2%. If its poverty rate were better by one standard deviation of the residual conditional on the median it would fall to only 68.6 percent. Even if it had the best poverty conditional on its median for any country in the bottom quartile it would fall by about 10 percentage points to 62.7 percent. In contrast, if that country grew by two percent a year for 20 years (which is roughly the average growth in the post WWII era) poverty would fall to 35.9 percent—about in half. If it grew at 4 percent per capita for 20 years (this is about one standard deviation above the average growth of 2 percent) predicted headcount poverty would fall to 12.1%. Sustaining rapid growth starting from a low median consumption expenditures reduces poverty 50 percentage points more than having the best observed poverty conditional on the low median. With sustained growth half the population moves out of extreme poverty compared to 10 percent even the best observed poverty with stagnant income (and just to be clear, the data here don’t tell what accounts for these observed low poverty rates conditional on the median).
Figure 2: Even getting to the best headcount poverty for a given median expenditures versus the average produces a small gain relative to the poverty reduction from sustained growth of the median
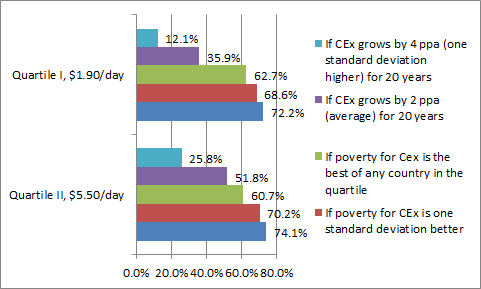
I do the same exercise with the second quartile of income and the $5.50/day poverty line, with roughly the same results. Even the best performance for poverty conditional on median produces gains much, much, smaller than the gains in poverty reduction from sustained rapid growth.
The results of these regressions are just facts about the world and do not directly reveal causal structures. In particular, there may well be cost effective poverty reducing programs that merit support by governments and/or philanthropists. The cross-national correlations can only speak to what have been the correlates of poverty, not what could be. But, while one doesn’t want to over-interpret facts, neither does one want to under-fact interpretations of very specific and particular empirical findings about specific programs either.
The next time you hear the phrase “solve global poverty” remember the number: .994. If what follows “solve global poverty” isn’t about raising median consumption expenditures a very good question is: “why not?”
(This blog is titled “Part I” because I plan a Part II that does a bit more on the technical issues of these types of decompositions and a Part III that discusses a bit the broader implications. But, unlike the Lord of the Rings (in which all three were filmed at the same time) these are not yet written and the future is unpredictable).