This article was finished in June 2019 for a collection of essays about RCTs (including a piece by Angus Deaton) and a really excellent piece on the rhetoric of Poor Economics (which argues the book is indeed poor economics but fantastic rhetoric in the Aristolean sense of merging logos, pathos, ethos) so is not at all a response to the Nobel Prize and all the hoopla. But, it turns out in a pre-written rebuttal to the arguments Banerjee and Duflo make in their recent Foreign Affairs article.
Turns out, as expected, we agree on a lot of things, like that getting growth going is the best thing to do. We also agree that their argument for RCTs hinges on two things.
First, it hinges on a really striking pessimism about the prospects for facilitating more rapid economic growth in any given country. They make a big deal out of that we economists cannot be exactly sure about what to do to promote growth (beyond obvious basics that have mostly been done) but, as I point out in the article, making modestly better decisions about big things is still far more important than great decisions about small things.
Second, it hinges on optimism about the extent with which the micro knowledge that RCTs generate can or will scale. Their argument is: “We don’t know how to do growth so lets invest in education and build courts that work.”
But there have been far more successful instances of accelerating economic growth in ways that led to sustained poverty reduction that there have been successful instances of going beyond expanding schooling (which most countries did and are doing) to improving learning outcomes. Some preliminary calculations with DHS data about literacy and schooling suggest that of out about 50 countries with data only 1 has had sustained success in improving literacy acquisition per year of schooling. So the idea that “we” (who?) don’t know how to accelerate growth (though, by the way, a fair number of countries have) but we do know how to “invest in education” (at scale) is not at all obvious on the face of it.
Similarly, I have done work on what we call “state capability” (of the type that would include “making the courts work” and again, at least at the aggregate level of the standard measures of state capability there is much less success on this than there is on growth–over half of countries have, by these standard measures, deteriorating state capability and most are making very slow progress. Again, the idea that “we” don’t know how to accelerate growth but do know how to improve the functioning of the courts is kind of hard given that there are many instances of the former and very few of the latter.
Spent an interesting couple of days in Paris with the chapter authors of a proposed book on RCTs, mostly with those amenable to the correct technical claims but skeptical of the outlandish claims that have been made. One of the authors is using the Gartner Hype Cycle as the organizing frame, thinking maybe we are headed to a relatively high “productivity plateau” after peak hype.
My paper argues that the RCT are not the disease but a symptom. The disease is the shift of focus from “national development” to “kinky development” or from doing and promoting developing to just trying to use limited, targeted programs to mitigate the worst consequences of the lack of development. It is pretty obvious that if one is asking questions about how countries successfully complete the four-fold transformation of development (productive economies, responsive polities, capable administration, and equalized social relations) the parts of that agenda for which RCTs can, even in principle, provide reliable (much less “rigorous”) guidance is tiny. It is only when one creates the illusion that “development” is about low-bar, sector specific targets that one can even imagine the design of “programmatic” interventions is at all central (and even then it is highly dubious). So RCTs are the research fad as a handmaiden of the larger shift to the kinky among North/Western agencies, which itself is a political shift due to their politics, having little or nothing to do with the facts of development or the interests of developing countries.
Attached is a very early draft of my chapter, will be substantially revised.
I spoke at the 25th Anniversary conference of the ERF (Economic Research Forum)–a consortium of economists from the Middle East/North Africa in Kuwait on March 12th. I spoke on the fact that the largest policy induced price distortion in the global economy (and probably in the history of mankind) is that the US price of low/medium skill labor is 5 to 10 times the world opportunity cost (supply). This makes labor artificially scarce.
This has the consequence that we live in the perverse world in which the scarcest resources on the planet–the very high opportunity cost scientific, technical, and entrepreneurial talent–is devoting itself to inventing devices to economize on, and hence drive down the demand for, low skilled labor.
This makes the pressing social, political, and economic challenge for most developing countries of finding good jobs for their youth bulge of (by global standards) low skill labor harder.
The massive distortions in the price and availability of low skill labor in rich countries is causing the world’s geniuses to devote their efforts to making things worse for the world’s worse off. There isn’t even yet a global discussion on how to stop this bias in the the pattern of technological change.
I am reading (parts of) Hume’s History of England (jet lag and all that) and he raises “damning with damning praise” to new heights in his discussion of Cromwell, who he clearly detests everything about but must acknowledge Cromwell’s amazing success at achieving his aims.
“This artful and audacious conspirator had conducted himself in the parliament with such profound dissimulation, with such refined hypocrisy, that he had long deceived those who, being themselves very dexterous practitioners in the same arts, should naturally have entertained the more suspicion against others.”
And the volume is full of such wonderful, old fashioned, sentences.
Sam Hickey and Naomi Hossain launched a new book with Oxford University Press today: The Politics of Education in Developing Countries: From Schooling to Learning. The book is case studies of the politics of education in six developing countries using a new theoretical framework, also used by Brian Levy (who contributes a chapter here) in his (edited) book on the politics of education in South Africa (The Politics of Governance of Basic Education: A Tale of Two South African Provinces). I will have more to say about Brian’s book in a week or two (I am in the middle of a review essay). According to the OUP website this book “Includes critical commentaries from leading scholars in the field”–one of those is my chapter. I could tell you what I said, but then you wouldn’t read it.
Here is a number to remember: .994 (and not because 994 is the country
telephone code for Azerbaijan).
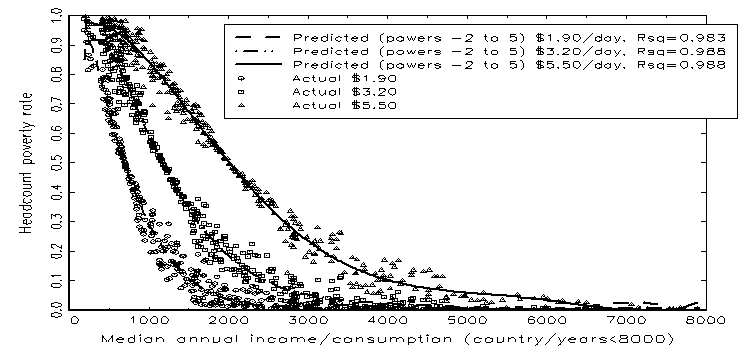
The measure of poverty most commonly used by the World Bank is the “headcount”: the proportion of people below a poverty line, a fixed level of income or consumption expenditures (CEX) per capita. The Foster, Greer and Thorbecke (1986) measures of poverty are weighted sums of people from a given distribution of consumption expenditures (or income), and the headcount is the simple case where the weights are equal for each person, irrespective of how far from the poverty line their CEX is.
This leads to a simple question: “How much of the observed variation in headcount poverty rates across countries is due to variation in the median of the distribution of consumption expenditures?”
The answer, shown in Figure 1, is (roughly) “All of
it.” The R-Squared of the median (with
various powers to account for non-linearity) for explaining headcount poverty
for the three poverty lines is:
$5.50 per day, R-Squared=.988,
correlation(poverty, predicted)=.994
$3.20 per day, R-Squared=.988, correlation(poverty,
predicted)=.994
$1.90 per day, R-Squared=.983,
correlation(poverty, predicted)=.991
The simple correlation between the actual $3.20/day or $5.50/day headcount poverty rate and headcount poverty as predicted using only the median of the country distribution is .994 and for $1.90 it is .991. These are about as high a correlation as real world data can produce.
Figure 1: Headcount poverty rates are extremely highly associated with median consumption expenditures
The regression uses the 389 country/time observations from
the World Bank data that are based on consumption expenditures (not income) and
recent data (not distant extrapolations). Since headcount poverty is a partial
integral of a distribution of consumption expenditures the relationship between
the median and headcount has to be non-linear.
I use powers of the median from -2 to 5 to allow for flexible
non-linearity.
Nancy Birdsall and Christian Meyer have argued that for
development issues “The
Median is the Message.” For headcount
poverty they are completely right. The answer to the question: “Why does a country at a given time have
headcount poverty rate it does?” is “Because of its median of consumption
expenditure.” Pretty much full stop. Conditional on the median, any and all other factors
or variables can explain at most 1.2
percent of the variation in country headcount poverty rates (maybe 0, but at most 1.2).
You might be saying, “Lant, why are you making such a big
deal of this correlation?” Well, thanks
for asking.
This very tight correlation is not built in. One can usefully decompose (as many have done)
the difference in poverty rates comparing two distributions (between countries
or over time) into three elements on the (mostly accurate) assumption the
distribution is log-normal (that is, the natural log of consumption
expenditures is distributed as a Gaussian normal distribution):
Differences in the central tendency of the log-normal distribution,
Differences in the variance of the log-normal distribution and
Differences in the distribution below the poverty line being more or less favorable to poverty than would be expected of a log-normal of a given central tendency and variance (as the log-normal is a two-parameter distribution this forces an exact shape).
How much of the variance in headcount poverty is an
empirical fact that depends on the actual distributions of consumption
expenditures across countries and the fact that (2) and (3) account for 1.2
percent of the variance could have been otherwise, it is not cooked into
definitions. In fact, one can easily
imagine policies or programs that would bring up the lower tail, and hence
reduce poverty, much more than the log-normal would predict. So it is a striking finding that both differences in variance
(inequality) with the assumption of log-normality and deviations from
log-normality below the poverty line together
account for at most 1.2 percent of observed variation in poverty.
Included in the country/time varying factors whose variation
in the observed data cannot explain
more than 1.2 percent of the observed variation in headcount poverty rates are
things like: “budget (government or other) devoted to anti-poverty programs”
and “efficacy of the design of anti-poverty programs” or “whether the country’s
anti-poverty programs are ‘evidence based’” or, for that matter, any
interaction of those factors, like:
“whether a country devoted budget to well-designed anti-poverty programs
based on evidence.” The median explains
nearly all variation in poverty across countries with no reference to targeted
programs of any kind: not micro-credit, not conditional cash transfers, not
chickens, not livelihood programs, nothing that claims to impact poverty
without changing the median.
Given the amount of time, energy, intellectual firepower, academic
publication, and advocacy that go into discussions of anti-poverty programs one might think they are a
large part of the “solution” to global poverty.
But they just have not been. If
your median consumption expenditure went up then your headcount poverty went
down and nothing else that any
country has done besides that seems to be very important in explaining poverty
reduction.
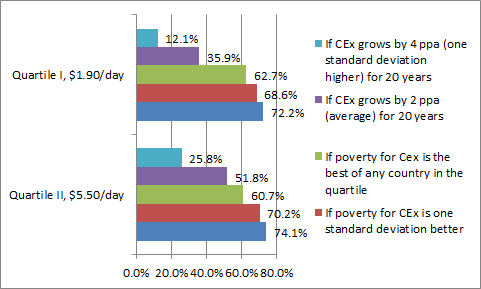
The relative importance of growth of median consumption expenditures versus “all else” can be illustrated with two different poverty lines at two different levels of income, the “extreme poverty” penurious poverty line that the World Bank often uses (but which I think is fundamentally illegitimate as it is too low) and the “$5.50/day” line (which I think is still too low).
The predicted level of $1.90/day “extreme poverty” for a
country at the average income of the lowest quartile of countries is 72.2%. If its poverty rate were better by one
standard deviation of the residual conditional on the median it would fall to
only 68.6 percent. Even if it had the
best poverty conditional on its median for any country in the bottom quartile
it would fall by about 10 percentage points to 62.7 percent. In contrast, if that country grew by two
percent a year for 20 years (which is roughly the average growth in the post
WWII era) poverty would fall to 35.9 percent—about in half. If it grew at 4 percent per capita for 20
years (this is about one standard deviation above the average growth of 2
percent) predicted headcount poverty would fall to 12.1%. Sustaining rapid growth starting from a low
median consumption expenditures reduces poverty 50 percentage points more than having the best observed poverty conditional on the low median. With sustained growth half the population moves out of extreme poverty compared to 10
percent even the best observed
poverty with stagnant income (and just to be clear, the data here don’t tell
what accounts for these observed low poverty rates conditional on the median).
Figure 2: Even getting to the best headcount poverty for a given median expenditures versus the average produces a small gain relative to the poverty reduction from sustained growth of the median
I do the same exercise with the second quartile of income
and the $5.50/day poverty line, with roughly the same results. Even the best performance for poverty
conditional on median produces gains much, much, smaller than the gains in
poverty reduction from sustained rapid growth.
The results of these regressions are just facts about the
world and do not directly reveal causal structures. In particular, there may well be cost
effective poverty reducing programs that merit support by governments and/or
philanthropists. The cross-national
correlations can only speak to what have been
the correlates of poverty, not what could
be. But, while one doesn’t want to
over-interpret facts, neither does one want to under-fact interpretations of
very specific and particular empirical findings about specific programs
either.
The next time you hear the phrase “solve global poverty” remember the number: .994. If what follows “solve global poverty” isn’t about raising median consumption expenditures a very good question is: “why not?”
(This blog is titled “Part I” because I plan a Part II that
does a bit more on the technical issues of these types of decompositions and a
Part III that discusses a bit the broader implications. But, unlike the Lord of the Rings (in which
all three were filmed at the same time) these are not yet written and the
future is unpredictable).