My 2017 book “Building State Capability” (with Matthew Andrews and Michael Woolcock)–which is available for free download) proposes the idea there is a “Big Stuck” in state capability. We showed that many of the available cross- national indicators of country level state capability showed four things (in Table 1):
- Many countries still show very low levels of state capability (below 4 on a zero to ten scale),
- Very few countries classified as “developing” countries have reached a high level of state capability—above 6.5–and most of those are small states so the total population in high capability states is very small.
- There appears to be very little progress in state capability as the measured growth rates show most countries with negative growth.
- Even for countries with positive growth, it is mostly slow and very few countries are on track to achieve high capability
Given the long lead times in producing a book, even though the book came out in 2017 the variety of country state capability indicators we used only extended to 2012 (now eight years ago) and mainly started in 1996 (when the World Bank’s Worldwide Governance Indicators (WGI) began). I decided to bring that table up to date to April of 2020 using the latest available indicators.
In the course of doing so, I put four different (sets of) indicators on a common 0 to 10 scale and produced graphs showing both the cross-national correlation of those indicators and their evolution over time (and their evolution over time). This note reports the results of this update of the key table with an indicator of state capability built from the Worldwide Governance Indicators as the simple average of their Rule of Law, Government Effectiveness, and Control of Corruption scores. I also report exactly the same table calculated form the Quality of Government indicator Quality of Government web-site which is itself originally from the International Country Risk Guide (ICRG) (all this explained below in “methods”).
The table is the book’s Table 1 update showing a country’s WGI State Capability level in 2018 in four categories (fragile, weak, moderate, and strong) and their measured rate of growth over the 1996 to 2018 period in four categories (collapsing, slow negative, slow positive, and rapid positive), where trend growth is the least squares growth rate . The three letter codes for each country are in each cell, sorted from the lowest to highest 2018 WGI SC level within each category so that, for instance, in the “moderate/slow negative growth” category Peru is the lowest, at just over 4 and Botswana is the highest, at just over 6.
To give some intuition in interpreting the rates of growth the scale is 0 to 10 so a growth rate of .05 implies it would take 20 years to improve (or decline) by 1 point or 200 years to improve by 10 points. For instance, in Latin America Haiti is roughly a 2, Peru roughly a 4 and Costa Rica roughly a 6. So even if Peru were (just) in the “rapid” growth category and had a growth rate of .05 it would take 40 years at progress of .05 to reach Costa Rica’s current level of state capability (improve two points). In Asia, the Philippines is 4.2 and Malaysia 6.4 so if the Philippines were just in rapid progress (.05) it would take 44 years to reach Malaysia’s current level. The category of “rapid” growth is not in fact super rapid.
Perhaps not surprisingly (as we have added only six years of data) the updated data confirm the main points of the “big stuck.”
First, 65/111 (only developing countries with population over 1 million are included) or 57 percent of all countries are still below a state capability level of 4, with 19 below 2.5 (fragile). While of course all “lines” in this space are arbitrary, countries below 4 have serious capability issues, just below 4 for instance are countries like: Egypt 3.81, Ethiopia 3.86, Zambia 3.82.
Second, only 6 countries are above the threshold for “strong” of 6.5. The level of 6.5 is roughly the lower end of the traditional OECD countries, for instance, Spain in 2018 is at 6.7 as is the Czech Republic and the high capability OECD countries are well above that (e.g. Denmark at 9.2, 2.5 points ahead of Spain). Of these six four have a population less than 10 million, Chile has 16 million and Korea is around 50 million so less than 100 million people total live in high capability developing countries.
Third, about 56 percent of countries (62/111) have recorded negative growth rates over the period 1996-2018.
Fourth, even of those with growth that is positive most have slow growth, with only 9 recording rapid growth (over .05), which implies that even the 40 countries with positive but slow progress recorded less than a 1 point gain on a 10 point scale over the 22 year period. Colombia, with a annual growth of .035 improved from 3.71 to 4.37, which, relative to most other countries is impressive progress, but at that pace it would take another 60 years to reach high capability.
| Total by level of capability | Collapsing (g<-.05) | Slow negative (-.05<g<0) | Slow positive (0<g<.05) | Rapid positive (g>.05) | Percent of all developing countries | ||
| Strong capability (l>6.5) | Names | 0 | CHL | URY, KOR, SGP | ARE, HKG | ||
| Number | 6 | 0 | 1 | 3 | 2 | 5.4% | |
| Moderate capability (4<l<6.5) | Names | TTO, KWT, ZAF, PRI | PER, LSO, BRA, PHL, MNG, PAN, MAR, LKA, SEN, ARG, TUN, THA, IND, BHR, NAM, OMN, CRI, BWA | BFA, SWZ, COL, TUR, ARM, VNM, CUB, GHA, CHN, JAM, JOR, SAU, MUS, MYS | KAZ, IDN, RWA, GEO, QAT | ||
| Number | 41 | 4 | 18 | 14 | 5 | 36.9% | |
| Weak (2.5<l<4) | Names | MDG, LBN, MRT | GIN, NIC, MOZ, GTM, KGZ, MLI, GAB, TGO, PNG, IRN, PAK, BOL, NPL, UGA, MWI, TZA, MEX, BEN, EGY, DOM, GMB | AGO, KHM, CMR, NGA, UZB, MMR, LAO, SLE, BGD, HND, PRY, NER, SLV, DZA, KEN, CIV, ZMB, ETH, ECU | LBR, AZE | ||
| Number | 45 | 3 | 21 | 19 | 2 | 40.5% | |
| Fragile (l<2.5) | Names | YEM, VEN, SYR, LBY, ERI, ZWE | SOM, PRK, CAF, BDI, GNB, TCD, HTI, SDN, TKM | AFG, IRQ, TJK, COG | 0 | ||
| Number | 19 | 6 | 9 | 4 | 0 | 17.1% | |
| Total by rate of change | 13 | 49 | 40 | 9 | |||
| Percent by growth category | 11.7% | 44.1% | 36.0% | 8.1% | 100% (111 total) |
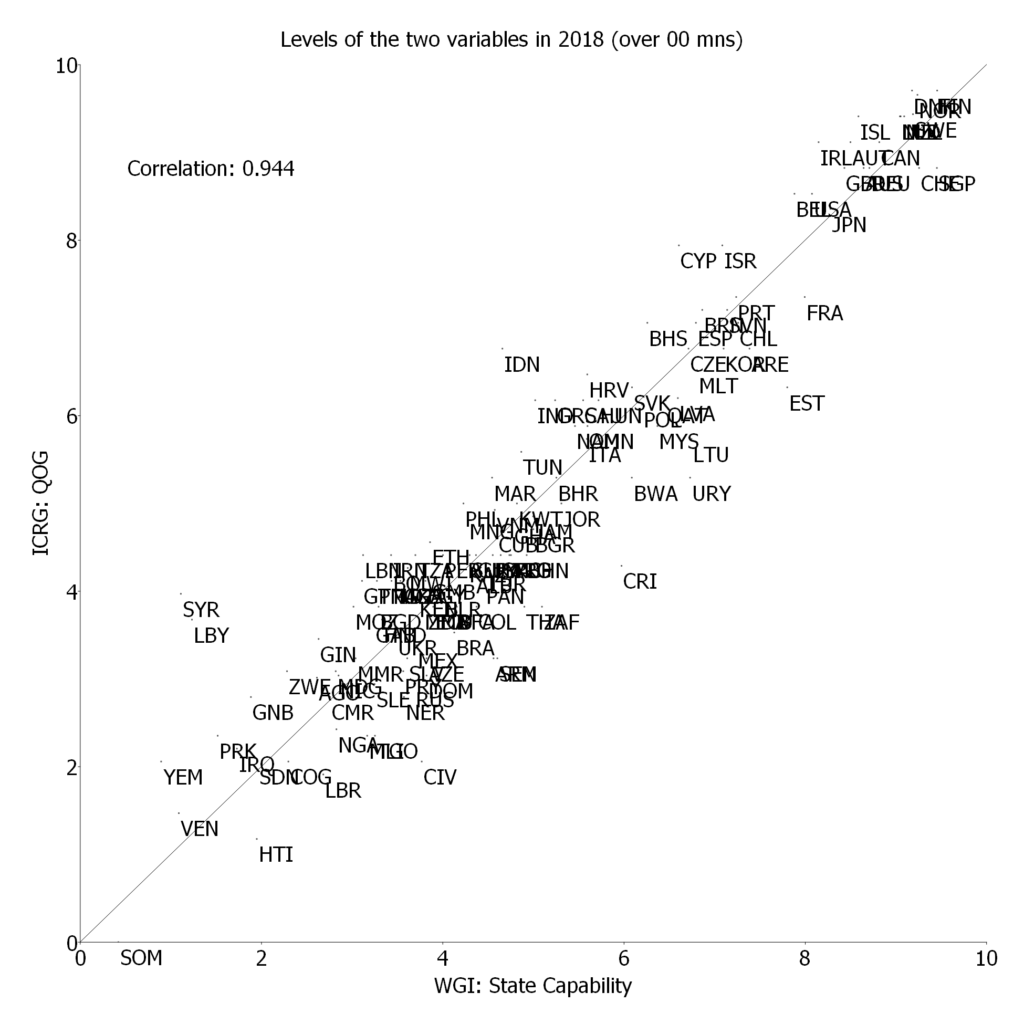
In order to address the issues with the fact that the WGI variable are not technically adequate for comparing overall trends over time as they are re-normed each year (though they do compare trends over time of each country relative to the average country in each year) we turn to a variable called “Quality of Government” (QOG) which is the simple average of three variables from the International Country Risk Group: Corruption, Bureaucracy Quality and Law and Order. This variable has data available going back to 1984 but we use only the data 1996 to 2018 (the latest available in May 2020). Reassuringly, this variable is very highly correlated with the WGI State Capability variable, the correlation in 2018 is .944 (Figure 1).
Figure 1: The cross-national correlation between the WGI State Capability and the ICRG QOG variable is very high
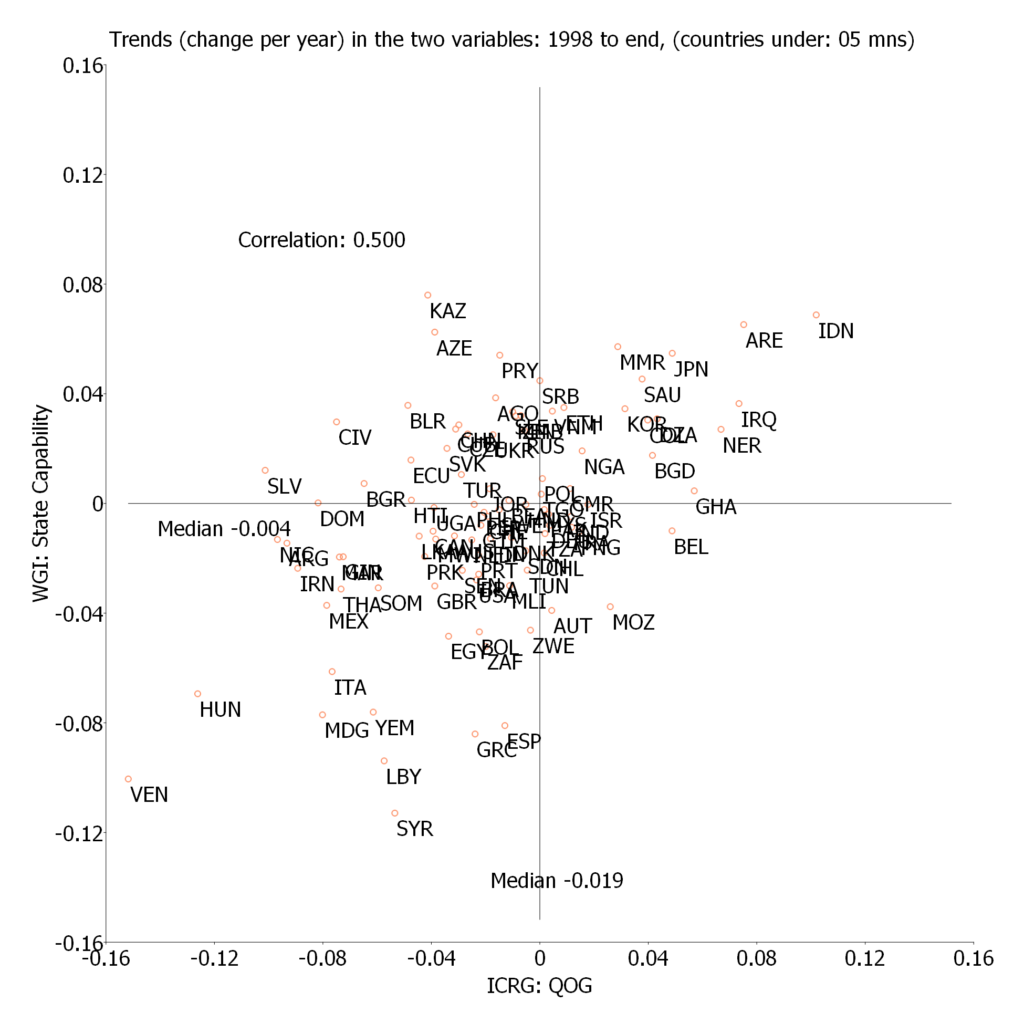
The QOG variable is meant to be comparable both across countries and over time and Figure 2 compares the growth rates 1998-2018 of WGI SC and the QOG variables. The correlation of the measured trends in the two variables are less correlated (it is nearly always true changes are less correlated than levels across countries) but is still correlated at .5 (only countries over 5 million population are included in this graph). Interestingly, the median measured annual growth in the QOG is substantially more negative than the trend for this set of countries (developing countries with more than 5 million people) at -.019 versus -.004 for WGI. This suggests the annual re-norming of the WGI, rather than masking a positive trend for developing countries may well be masking a negative overall trend.
Figure 2: There is a strong correlation between the measured trends in the WGI State Capability variable and the ICRG QOG variable—and the median growth rate is lower for QOG than WGI SC
| Total by level | Collapsing (g<-.05) | Slow negative (-.05<g<0) | Slow positive (0<g<.05) | Rapid positive (g>.05) | Percent of all developing countries | ||
| Strong capability (l>6.5) | Names | 0 | KOR, SGP | CHL | IDN, ARE | ||
| Number | 5 | 0 | 2 | 1 | 2 | 5.6% | |
| Moderate capability (4<l<6.5) | Names | GMB, CRI, LKA, ARG, IRN, TTO, MAR, NAM | EGY, GTM, PAK, PAN, PNG, UGA, BOL, MWI, TUR, KAZ, CHN, PER, TZA, CUB, JAM, MNG, VNM, JOR, KWT, PHL, BHR, TUN, MYS, OMN | DZA, LBN, ETH, GHA, BWA, URY, IND, QAT, SAU | 0 | ||
| Number | 41 | 8 | 24 | 9 | 0 | 45.6% | |
| Weak (2.5<l<4) | Names | DOM, NIC, MDG, ZWE, PRY, SLV, MEX, GIN, LBY, ECU, THA, ZAF, KEN, SYR | CMR, SLE, AGO, AZE, SEN, BRA, GAB, HND, BFA, MOZ, ZMB | ARM, MMR, BGD, COL | GNB, NER | ||
| Number | 31 | 14 | 11 | 4 | 2 | 34.4% | |
| Fragile (l<2.5) | Names | SOM, HTI, VEN, CIV, COG, YEM, PRK | SDN, MLI, TGO, NGA | LBR | IRQ | ||
| Number | 13 | 7 | 4 | 1 | 1 | 14.4% | |
| Total | 90 | 29 | 41 | 15 | 5 | ||
| Percent by growth category | 32.2% | 45.6% | 16.7% | 5.6% |
The four principal “big stuck” findings emerge using the QOG data for the 90 developing countries with population over 1 million for which there is both WGI and QOG data.
First, 43/90 (48.8 percent) of these countries have Weak or Fragile Capability. This is lower than WGI SC mainly because QOG had more countries in the “moderate capability, slow negative growth” cell (24 versus 18 even though QOG has 20 less countries total) but, as can be seen in figure 1 many of these countries are just above the threshold of 4.
Second, only 5 countries are above the threshold for “strong” of 6.5.
Third, given that the average recorded growth rate in QOG over the 1996 to 2018 period is lower, many more countries show negative trends. 70 of 90 (77.8 percent) countries have negative trends. This data suggests that the re-normalization each year of the WGI data may prevent it from showing an overall downward trend in state capability.
Fourth, there are only 5 countries with rapid growth, two with high capability already (Indonesia and United Arab Republic (ARE)) and three recovering but still at low levels (Iraq, Niger and Guinea-Bissau).
I also examined the data from the Fund For Peace using their ranking on “Public Services” and the data from the Bertelsmann Transformation Index. In doing so, I create a large number of graphs that display the data for each country and display the cross-national correlations, both in levels and trends, among the six WGI variables plus the created State Capability variable, and the other indicators. All of these are available in the links provided.
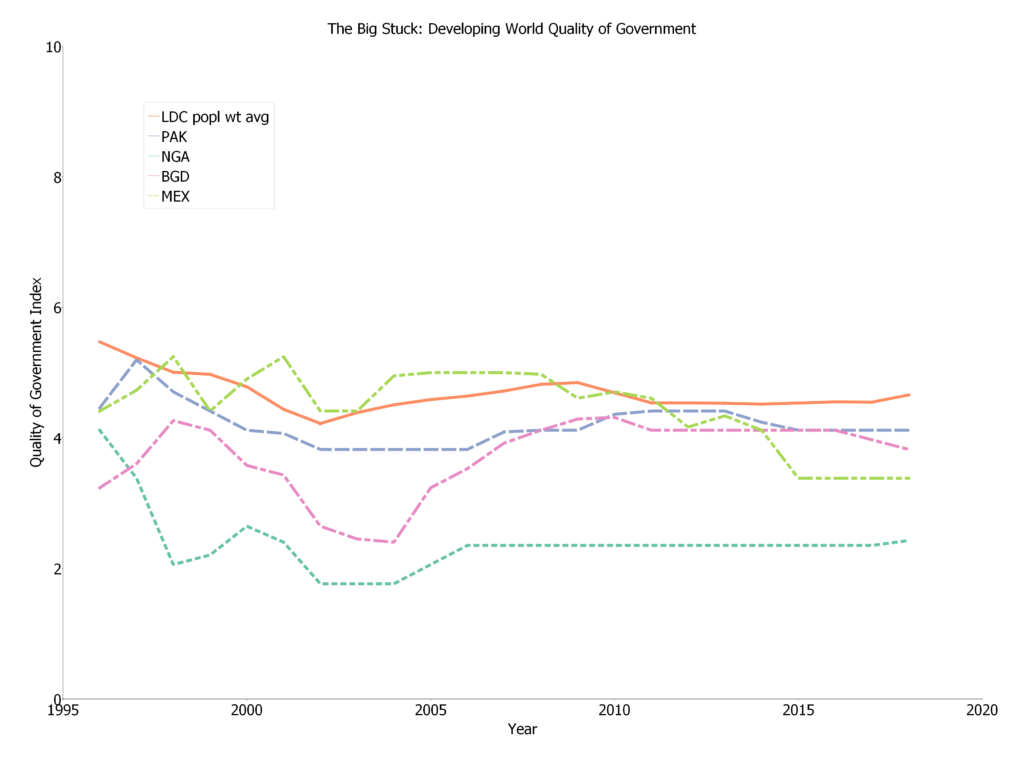
Figure 3 and Figure 4 show the evolution of the QOG rating for the developing country population weighted average and for the largest eight countries by population: China, India, Indonesia and Brazil in Figure 3 and Pakistan, Nigeria, Bangladesh, and Mexico in Figure 4. This is to allow the reader to ‘groundtruth’ the ratings against countries they know something about. For instance, the QOG regards India (green dotted line) as well above the average and having had quite stable ratings over this entire period. Indonesia is seen by the QOG ranking to have experienced a substantial deterioration from 1996 to a nadir in 2004, after which a recovery to near 1996 levels by 2009, followed by some deterioration, followed by a large jump in 2018. TheQOG regards Brazil (green dash-dotted line) as having experienced a considerable deterioration over the period since 1996 (with some volatility). Having lived and worked in India off and on since 1991 I think the “stagnation” of state capability would be regarded as a generous assessment. Again, having lived in Indonesia from 1998 to 2000 and worked there off and on since, this general pattern of weakening capability from the “top down” authoritarian capability of the Soeharto era but re-built to 2010 seems plausible. I have no idea what the QOG thinks happened in 2019, I suspect this is a mistake but is in the original data. Brazil I know too little about to have a view.
Figure 3: Evolution of the QOG measure 1996-2018, developing country population weight average and four largest countries
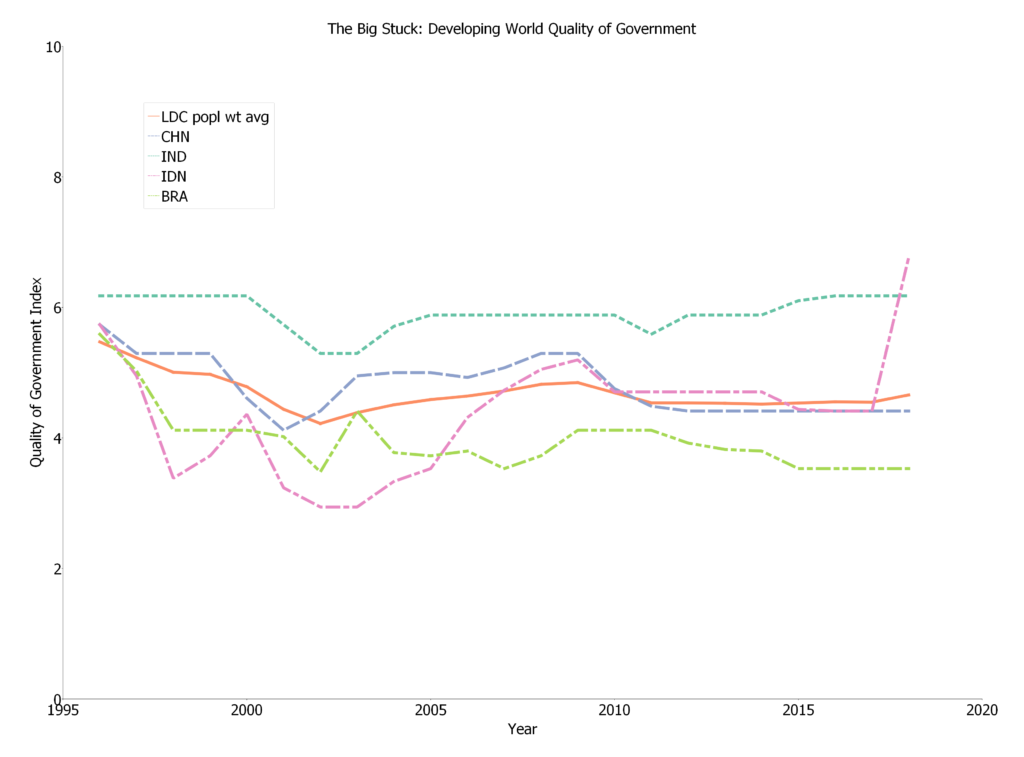
Figure 4: Evolution of the QOG measure 1996-2018, developing country population weight average and next four largest countries
Appendix I: Data and methods
There are four primary sources of data, here I describe each and the transformations made to each variable. On the web site both the raw data and the programs that transform the data will be posted.
- World Governance Indicators
The WGI data was downloaded form the web site (https://info.worldbank.org/governance/wgi/) and the latest update was 2019 with data through 2018 starting in 1996.
I made several transformations.
First, to make the data annual I interpolated between the early years when the data are only available every other year (e.g. I filled in 1997 as the average of 1996 and 1998).
Second, I transformed each of the six WGI variables to a scale of 0 to 10 by taking the worst ever recorded value for any country any year and the best for any country any year and re-scaling zero to the worst and 10 to the best.
Third, I created a variable called “State Capability” as the average of Rule of Law, Government Effectiveness, and Control of Corruption. I feel the other three are conceptually distinct from capability: Voice and Accountability, Political Stability, and Regulatory Quality. Note that this variable is not exactly scaled 0 to 10 no country was 0 or 10 in all three variables in the same year.
- Quality of Government
I downloaded this variable from the Quality of Government Institute web site (https://qog.pol.gu.se/) which provides cross-national, over time data on hundreds and hundreds of variables. One of those is called (confusingly, if you ask me) Quality of Government and is the average from the International Country Risk Guide’s ratings since 1984 of Law and Order, Bureaucracy Quality, and Corruption. (This is because the original data from ICRG is (or has been) proprietary and expensive so only the average could be shared).
I only use data from 1996 to 2018 as (a) this is the only period for which the WGI overlaps and (b) there are some questions about the long-run comparability.
This variable is scaled 0 to 1 and I rescale 0 to 10 in the same way as above.
- Fund for Peace: Public Services
The Fund for Peace produces a Fragile States Index based on 12 indicators (https://fragilestatesindex.org/data/). One of those indicators is “Public Services” and I used that indicator, which is described as:
The Public Services Indicator refers to the presence of basic state functions that serve the people. On the one hand, this may include the provision of essential services, such as health, education, water and sanitation, transport infrastructure, electricity and power, and internet and connectivity. On the other hand, it may include the state’s ability to protect its citizens, such as from terrorism and violence, through perceived effective policing. Further, even where basic state functions and services are provided, the Indicator further considers to whom – whether the state narrowly serves the ruling elites, such as security agencies, presidential staff, the central bank, or the diplomatic service, while failing to provide comparable levels of service to the general populace – such as rural versus urban populations. The Indicator also considers the level and maintenance of general infrastructure to the extent that its absence would negatively affect the country’s actual or potential development.
This data is available from 2006 to 2019. I re-normed the data to the 0 to 10 scale from the raw data (in which high numbers are bad).
- Bertlesmann Transformation Index
This index of country performance has three components: political transformation, economic transformation, and governance index. The governance index has five elements: the level of difficulty, steering capability, resource efficiency, consensus building, and international cooperation. As indicators of state capability I only focus on two of those: steering capability and resource efficiency, each of which has three sub-components. The sub-components of steering capability are: prioritization, implementation, and policy learning and of resource efficiency are: efficient use of assets, policy coordination, and anti-corruption.
The indicator I use in the graphs is the average of steering capability and resource efficiency, each of which is normed to 0 to 10 and then added (so again the added indicator is not again re-normed so it is not minimum of 0 and maximum of 10).
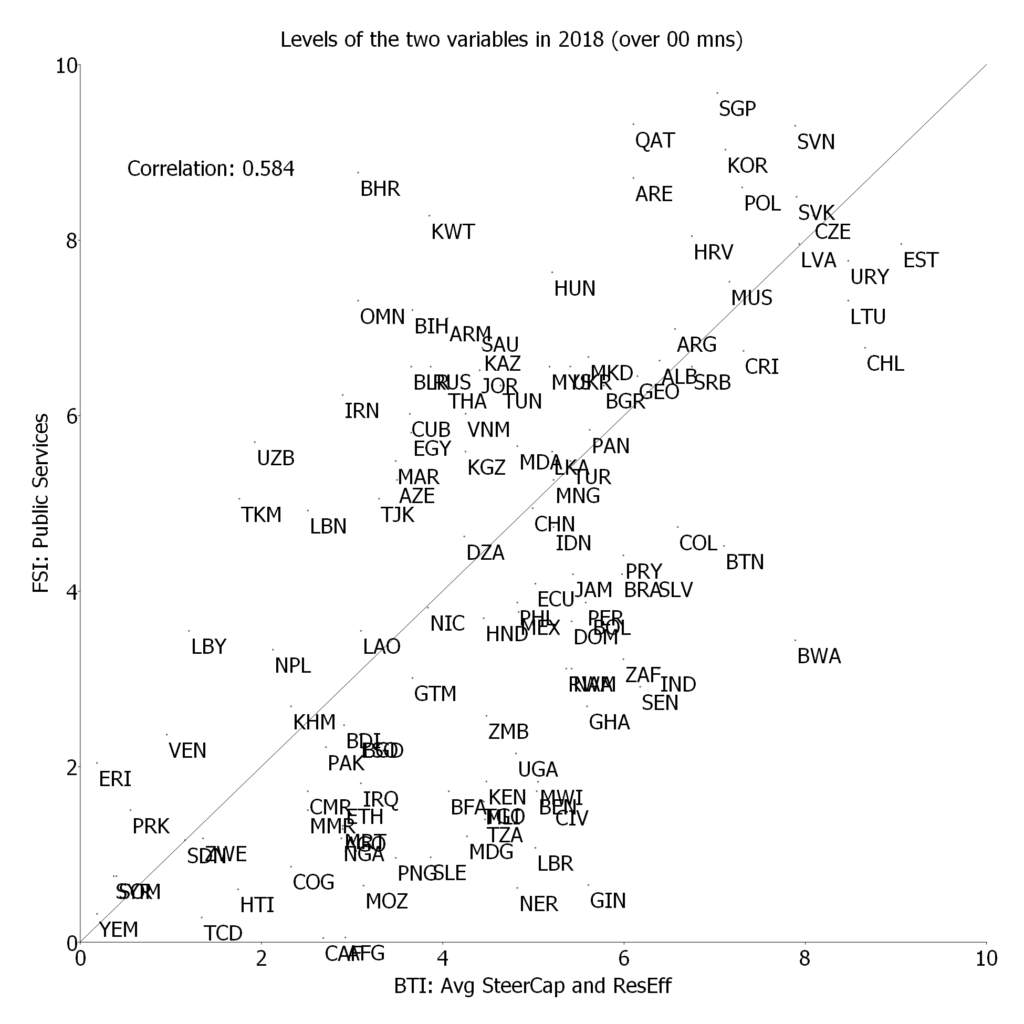
As can be seen in the graphs below, these four indicators are reasonably highly correlated across countries in levels—but some higher (e.g. WGI: SC and ICRG: QOG at .944) and some lower (e.g. FSI: PS and BTI: SC+RE at only .584). The correlations are even lower in trends (again these graphs exist) over time and the BTI and FSI only exist since 2006 so have a relatively short time series.
The BTI shows a much higher trend rate of improvement than the other indicators, for reasons I do not understand and therefore am not sure I trust but would produce a more favorable view of big stuck than the others.
All of the transformations from raw data, calculations and the production of the graphs was done in GAUSS. In this folder the raw (excel) versions of the downloaded data and all of the programs are available and should allow replication.
Appendix II: Descriptive graphs produced
In the course of producing this update I produced descriptive graphs of seven different types. Here I describe each type of grand and show a single example (some graphs were produced for each of 177 countries so they cannot all fit in a single document). All of the graphs will be made available on-line on the Building State Capability web site.
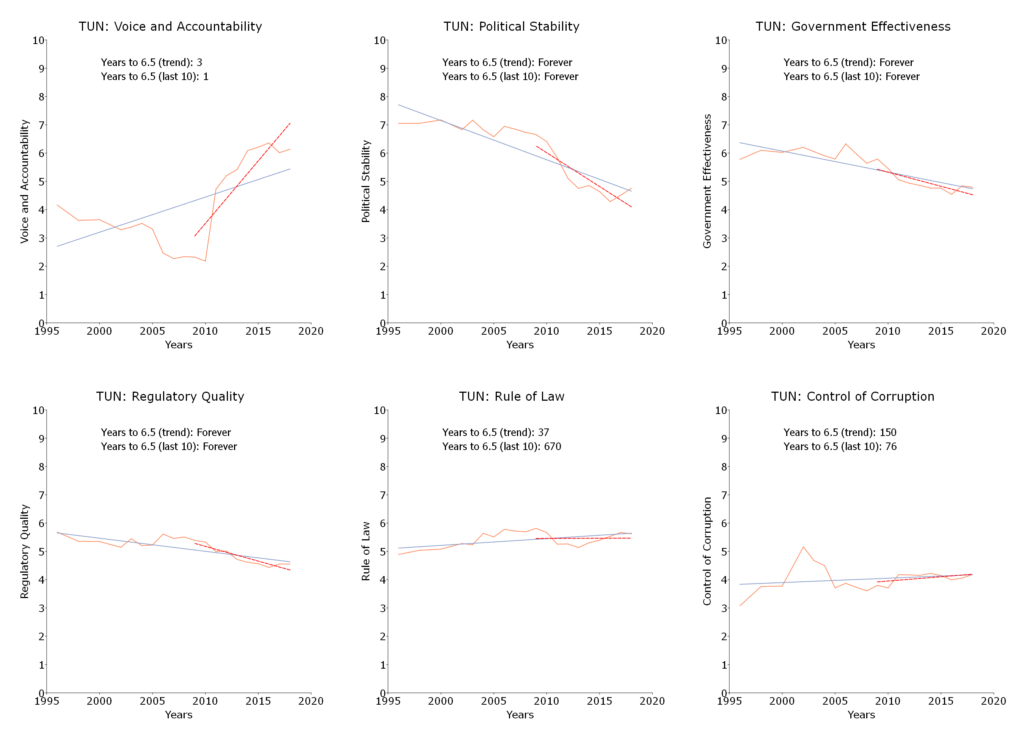
- Graphs showing the time series evolution of each of the six WGI variables
These graphs show the data over time for each of the six WGI variables, with an overall trend line, the trend of the last 10 years, and years to a high level (>6.5) at either the overall or the recent trend line. All graphs have a vertical axis from 0 to 10 so that levels and trends can be visually compared across the variables and across countries. The link has a folder with a downloadable graph for each of the 177 WGI countries, like the one shown below for Tunisia.
- Graphs showing the cross-national correlations of the six WGI variables and the derived State Capability variable
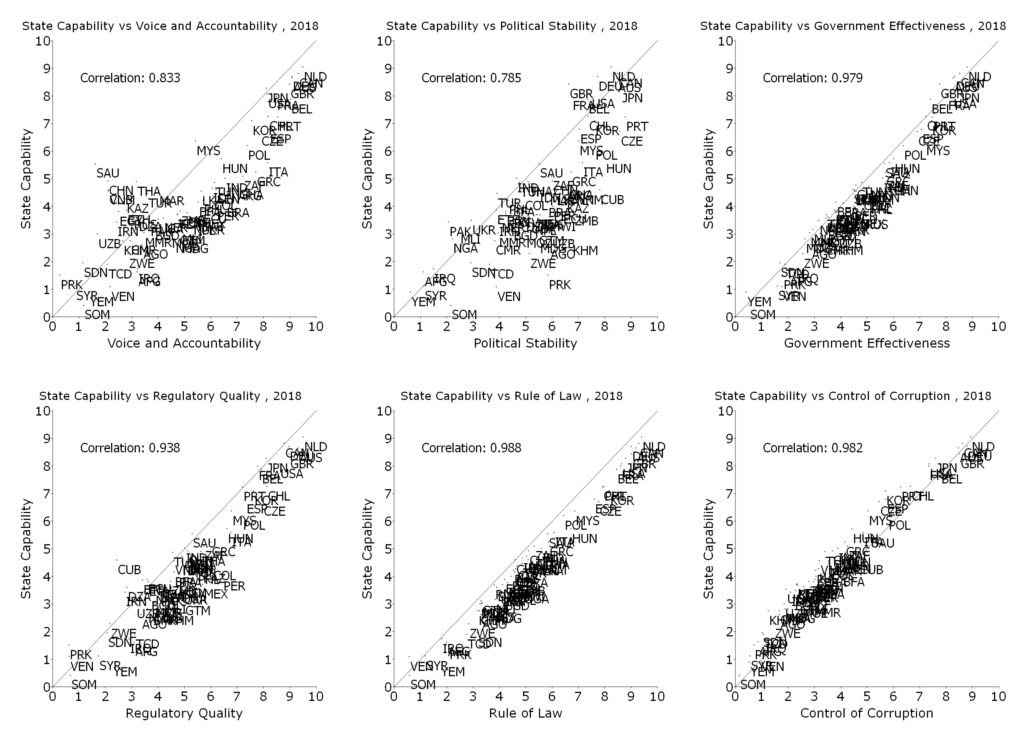
The second type has seven graphs that show the cross-national correlation in 2018 between one of the WGI variables and all other six and reports the correlation between the variables. Shown below is the example graph showing the correlation between Voice and Accountability, the other five WGI variables and State Capability (which is the average of Rule of Law, Control of Corruption and Government Effectiveness and hence has a high correlation with those three measures by construction). These seven graphs are available here.
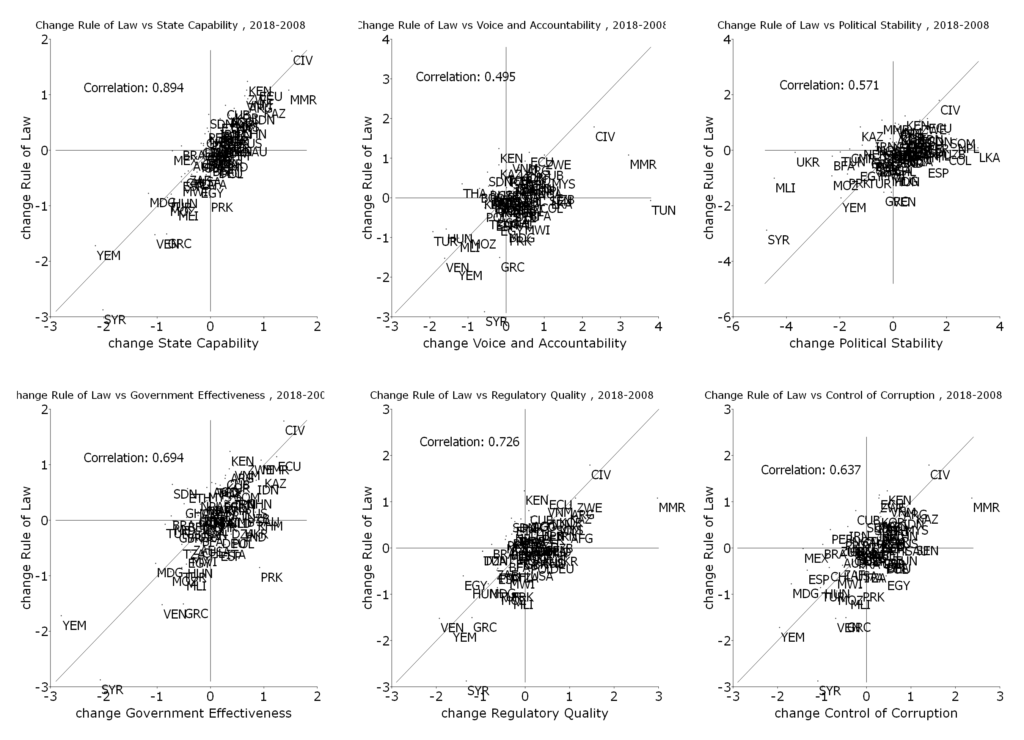
- Graphs of all seven WGI variables showing the association across variables of the trends
This set of graphs show the cross-national association of the trends in each of the WGI variables against each of the six other WGI variables. Each point is the least squares estimated growth rate for each variable for each country. Shown here is the graph for Rule of Law with all six other WGI variables and shows the extent to which the trends are associated across the variables. These seven graphs (each with six panels) are available here.
- Showing the level and trend in the seven WGI variables across countries
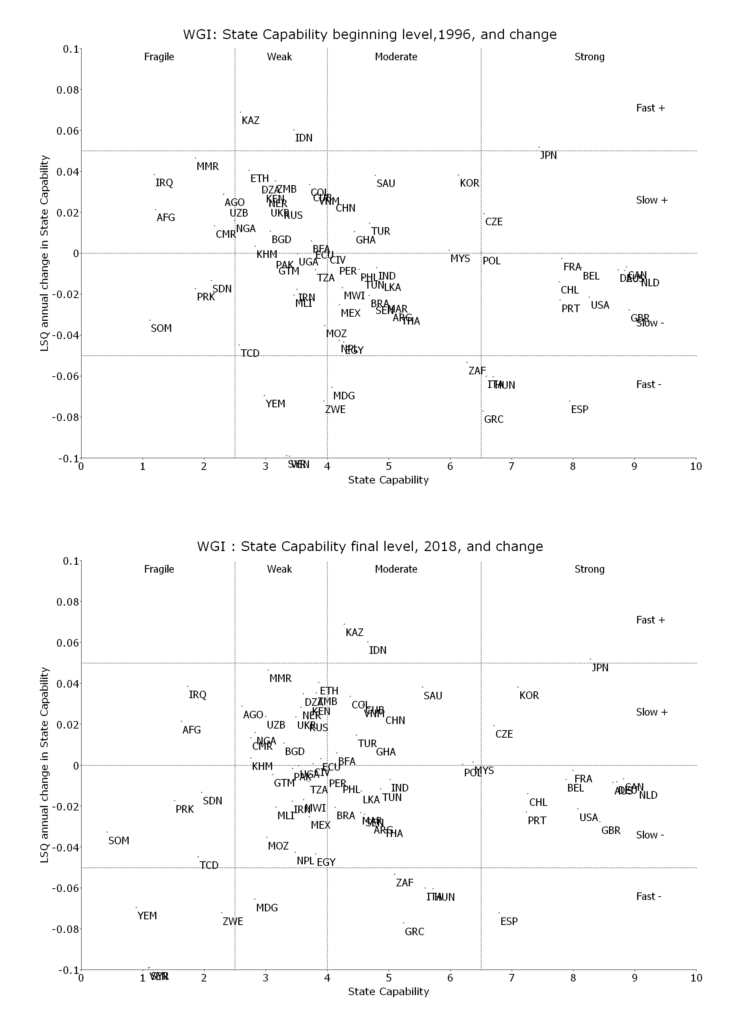
These graphs show, for each of the seven WGI variables a cross-national graphs showing the level of the indicator on the horizontal axis (either in 1996 or in 2018) and the trend on the vertical axis. If the starting point is 1996 this potentially shows “convergence” if countries that start with low levels have a tendency to more rapid growth). Since there are many countries the graphs can get very cluttered so some of the graphs show just countries over a threshold population (like 1 million, 5 million, 10 million) for ease of identifying countries (the graphs shown is only for countries over 10 million and so excludes some interesting countries that had massive governance changes over this period like Rwanda and Georgia). These graphs have lines dividing the levels and growth rates into exactly the thresholds used in Table 1 and hence are the exact graphic counter-part of the table (when 2018 is the endpoint). Shown is the graph for state capability (which is exactly Table 1 above except that the Table is limited to developing countries and that the axis is flipped (e.g. in Table 1 levels are vertical and growth rates horizontal). These seven graphs (for each population threshold), each with two panels, are available here.
- Trends in four different indicators of state capability
As described above in “methods” I explored four different sets of indicators of aspects of the broad concept of “state capability”: (i) the World Governance Indicators which have six indicators, (ii) the Quality of Government indicator which is built from the ICRG ranking of three indicators, (iii) the Fund for Peace rankings of state fragility, which have ten variables, I focus on the “public services” indicator, (iv) the Bertlesmann Transformation Index which has a number of indicators and sub-indicators and I focus on the ranking of “Steering Capability” and “Resource Efficiency.”
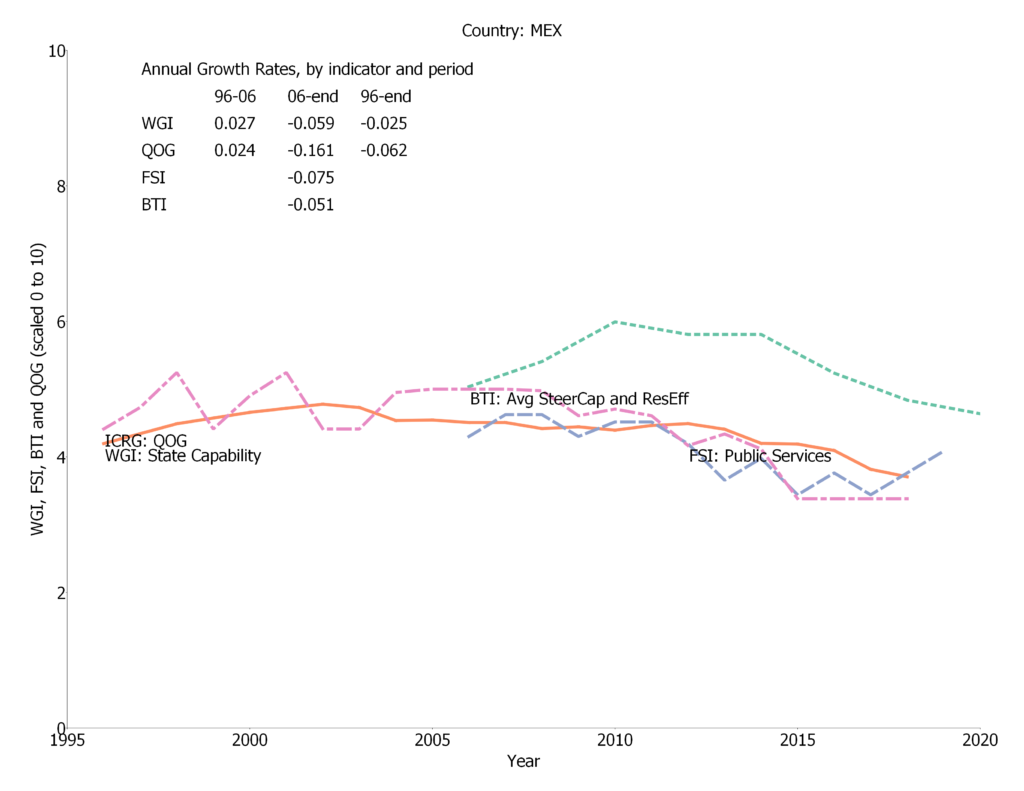
The third set of graphs show the evolution over time for each of these four indicators (for whichever are available) for each of the 177 countries with WGI data. Since the data is available for different periods the graphs show the trends for the 1996-2006 period (for just WGI and QOG), the 2006 until end of data (between 2018 and 2020) period for all four variables and the overall period (for just WGI and QOG). The country example (of the 177 available) is Mexico. These 177 graphs are available here.
- Cross section of all four different sources of state capability
These graphs show, for each indicator, the cross national association another of the three indicators and the correlation.
The example shown here is the correlation of the BTI average of Steering Capability and Resource Efficiency with the FSI indicator of public services. These 12 graphs are available here.
- The association of the trends in the four indicators of state capability
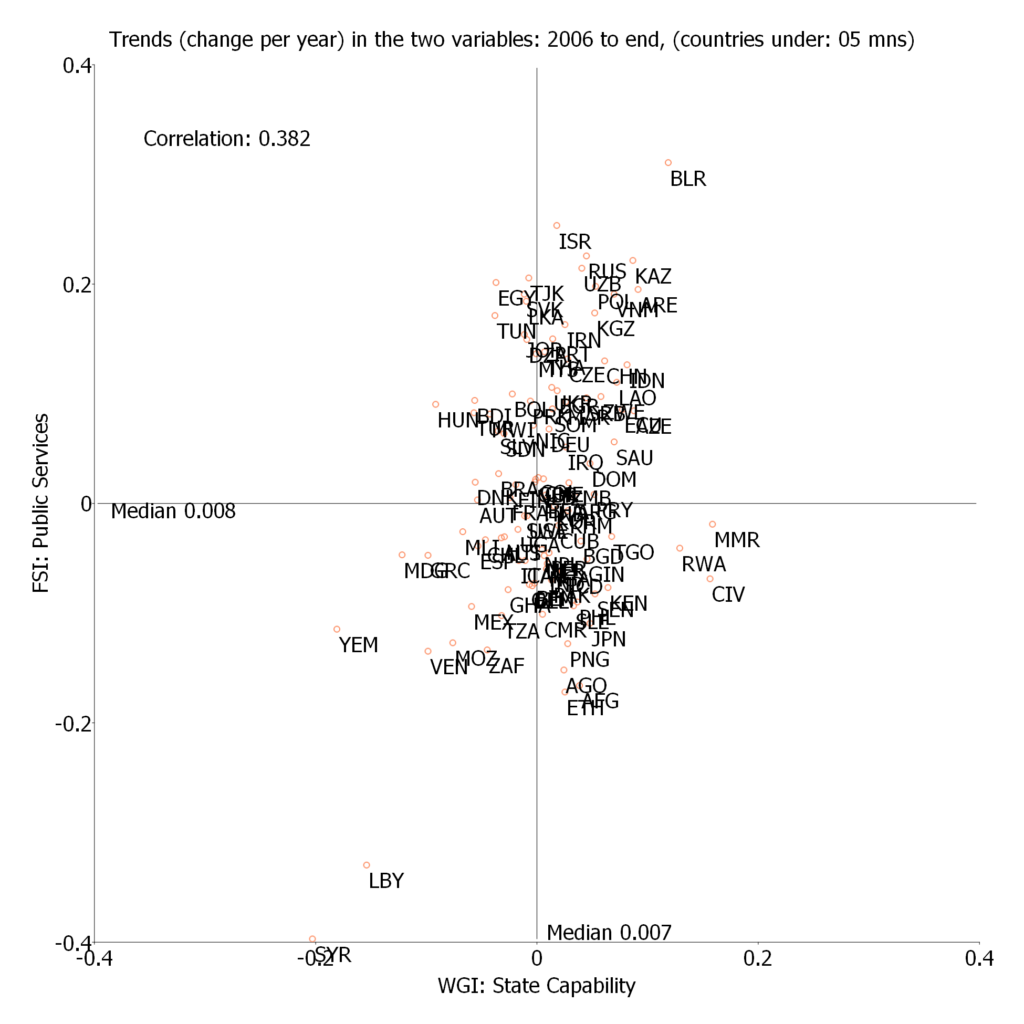
These graphs show the cross-national association for any one of the four variables between the trend (over the available time period) of that variable and the other three variables over that same period. This also shows the median of the trend growth in the two indicators.
The example shown is the trends of the FSI Public Services indicator from 2006 to 2019 with the WGI State Capability variable from 2006 to 2018 (this is for countries with over 5 million in population). These graphs (both for all countries and those over 5 million) are available here.